QAS PPA Time Warp Index©
The Pension Protection Act of 2006 requires the use of either a 3-segment rate or a 100 year curve for funding purposes. PPA 3-segment rates are determined by averaging the PPA monthly curve rates over 24 months. Once averaged, the resulting 3-segment rates move in one direction or another over time. PPA curve rates move much more quickly than PPA 3-segment rates. This creates a lag effect which occurs in both falling and rising rate markets. We refer to this phenomenon as PPA Time Warp©. While PPA 3-segment rates may dampen funding volatility, in periods of poor returns that usually come with lower interest rates, it prolongs the agony of getting to full funding.
QAS PPA Time Warp Index©
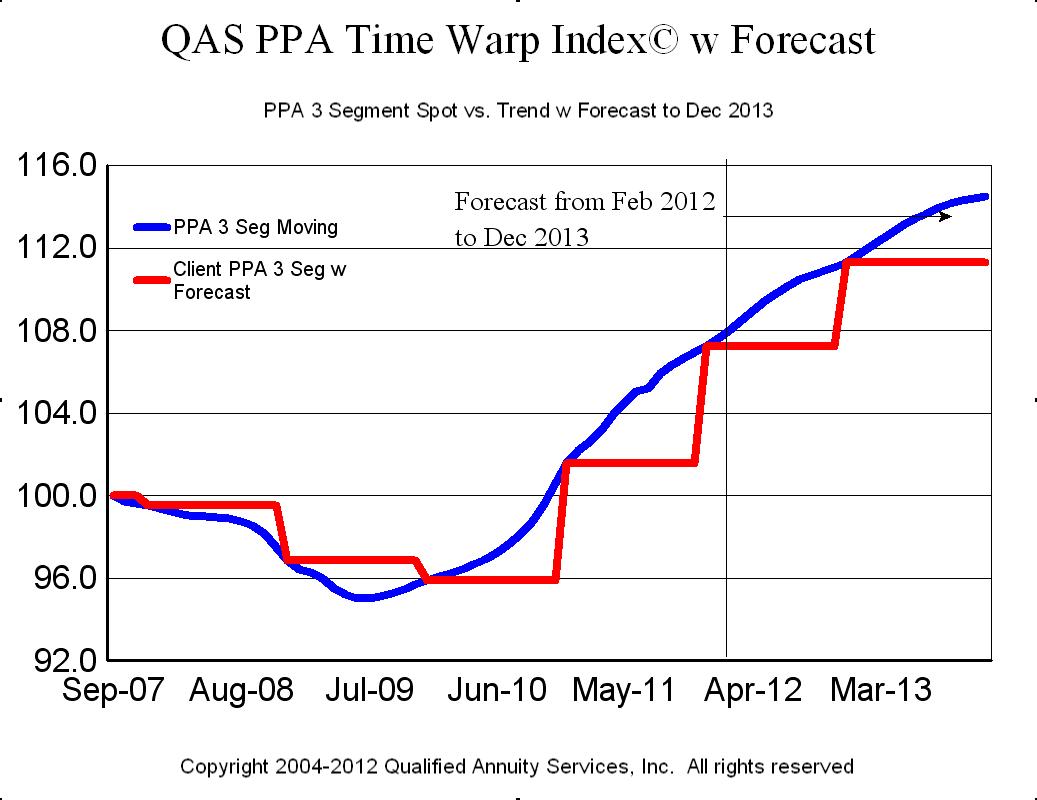
The QAS PPA Time Warp Index© tracks the monthly movement of a notional pension plan liability at PPA 3-segment funding rates. It also tracks and plots the annual “point to point” at which time the notional plan liability is again valued. The resulting “up tick” or “down tick” can be quite dramatic.
Purpose of the QAS PPA Time Warp Index©
The QAS PPA Time Warp Index© removes the “noise” and effectively illustrates the change in liability solely due to changes in the PPA 3-segment rates. Many may argue that pension liabilities are soaring due to low interest rates used for funding. The PPA Time Warp Index© isolates the change in liability due to interest rate movement alone. Liability growth that exceeds the Index would generally result from further benefit accruals and changes in plan demographics such as longevity.
Construction of the QAS PPA Time Warp Index©
The QAS PPA Time Warp Index© is based upon the QAS PRT 1000 Index© which was constructed from research on 1000 of the largest DB plans in the U. S. A Model Plan was valued using PPA mortality and PPA 3-segment rates as of September 1, 2007 and has a beginning value of 100.0 which is the Index Base. The QAS PPA Time Warp Index© uses the same beginning date and value of 100.0. The annual reset is either an “up tick” or “down tick” for the next plan year.
Profile of the QAS PPA Time Warp Index©
The QAS PPA Time Warp Index© provides a view to the trend for the “most recent cost to fund” versus the “projected future cost to fund” a notional plan liability. The QAS PPA Time Warp Index© isolate the relative change in the Model Plan Liability due to rates alone. The Time Warp Index© helps to evaluate future funding based solely upon changes in assumptions in PPA interest rates.
Monitoring PPA Liabilities
The QAS PPA Time Warp Index© provides a discrete view to the magnitude of the change in liability under PPA and facilitates developing risk based strategies, especially Pension Risk Transfer. The Index provides a view without potentially costly delays of valuations or stochastic modeling. The PPA Time Warp Index© helps measure levels of change in liability as plans take actionable steps to de-risk or prepare for a termination. The QAS PPA Time Warp Index© also helps to quantify directional momentum in rates. As plan sponsors face challenges of pension finance, the directional movement of PPA 3-segment rates can be monitored nearly in real time to assist in evaluating possible strategies for either asset allocations or for potential savings through risk transfer.
PRT and PPA 3-Segment Rates
Plan sponsors have been saddled with funding deficits at a time when economic stress has risen to all time highs. This jeopardizes pension solvency. As interest rates rise, plans that are heavily invested in bonds or bond driven LDI portfolios will not benefit from lower PRT costs. From a tactical view, LDI is suspect if allocations to bonds are implemented at a time when bonds are deemed “overpriced”. The velocity of a trend toward higher rates impacts the value of PRT. As rates rise, discounts through PRT emerge. However, managing a PRT strategy for a plan that has already adopted bond oriented LDI requires significant skill and a high degree of patience.
PPA 3-Segment Rate Hedge Opportunities
DB plans should strongly consider the inherent hedge value of PRT compared to the behavior of slow moving PPA 3-segment rates. PRT rates for Retirees correlate to the PPA curve. From strategic and tactical viewpoints, it is crucial to grasp the impact of capital market conditions that drive PPA curve and 3-segment rates versus PRT pricing and LDI cash flow matching strategies. The QAS PPA Time Warp Index© is a benchmark that compares and evaluates the impact of changes in liability due to changes in PPA 3-segment rates.